Tempo Analysis
Click For Python Demo:
A Multi-Dimensional Model
The Algorithm
The algorithm for determining the beat embarks by running a function from the librosa python audio library which measures the onset strength of the audio signal by passing in the waveform, along with the sampling rate as the main variables. Then, using the beat_track function, the tempo, which is also know as ‘beats per minute’ (bpm) is found as well the beats, which essentially is an array that stores the exact time of each beat during the audio signal. We then calculate the FFT and plot a spectrogram in the Mel scale. The Mel scale (from the word “melody”) accounts for listeners' logarithmic sensation of pitches equal in distance, and balances out the dynamic range of the signal. An example of Mel scaling is as follows, where f is the original spectrogram.
By plotting the Mel spectrogram we can see the high energy spikes covering a very wide range of frequencies, which in the recording are signified by the metronome, and express the tempo. An example of this is shown in figure 1, at the bottom of this page. Followingly, we use the exact time of the beats as well as the onset strength calculated for both signals to plot the two novelty curves seen in figure 2, as well as the vertical spikes of the two audio signals which showcases precisely the time of the beat, expressed as dashed lines, on the same figure. Mathematically, the novelty curve is acquired by summing up those positive discrete derivative of the Mel spectrum.
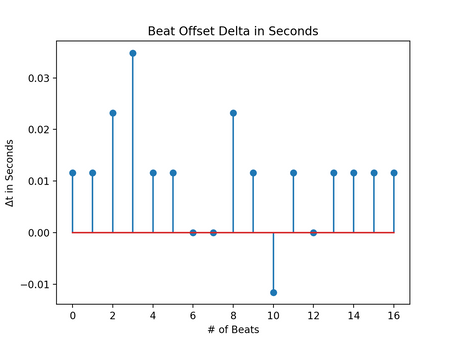
A helper function then calculates the delta difference of each beat separately to evaluate whether the practice audio piece is on time, slower or faster than the original. This is then printed out in the terminal, for the testing phase, where there is a review for each beat, shown in figure 3. On a separate figure, the Δt time difference in seconds is plotted for each beat to visualize the positive or negative delta of the error for each beat. This is what we are using to determine our scoring for the tempo.
Plots and Findings
In figure 1 at the bottom of this page, the Mel scaled spectrograms for each the ideal audio file at the top and practice audio below it are plotted. The test files used are two home guitar recordings of the same piece, with a metronome running, and minor errors in the playing. The recordings can be found in our Google Drive, on our 'Downloads' page. The spectrograms seen in the first two plots seem already very alike and are used to extract the novelty curve information for figure 2, as was analyzed in the section above. In that second figure, the green dashed spikes show the original piece’s beat while the orange vertical dashed lines signify the practice piece. After running the loop that calculates the error in time of those beats, figure 4 shows the delta of the time difference for those 17 beats. It is seen how the beats are for the most part consistent in terms of error. Additionally, in figure 3, the terminal is displayed where we are printing the bpm’s for each piece at the top. Then, a short review for each beat is printed that determines if the practice piece is going in too fast, too slow, or just right on each beat, when compared to the original.
Scoring and Obstacles
The scoring method is quite simple. We have identified two parameters for weighting the score of each beat, where a full point is given if the beat is exactly on time at with no error, and half a point if the beat is within 0.02 seconds from the ideal beat time. If the delta error is larger than 0.02 s then no points are given. Then, the score is simply the sum of the points awarded for each beat, divided by the number of beats. This final score for the tempo is then weighted by 25% to be added in the overall score, since tempo is only a quarter of the analysis.
The algorithm at the moment is largely based on the onset strength function, which is not always the best way to measure bpm. After significant dataset testing, it has been determined that our code will work best with audio pieces where a time-keeping instrument is in place, such as a metronome, drums or a bass. As of this moment, the code will still be able to compare two piano or guitar pieces played at various speeds and alternating time signatures, but the comparison will be purely relative. In addition, the helper function will crash if the beat arrays are not of the same length, thus we are using the duration function, which determines the shorter audio piece, and uses that length to sample both signals when loading them in the code, so that both arrays are of equal length.


