Timbre
Click For MATLAB Demo:
A Multi-Dimensional Model
Average: Spectral Centroid/Brightness
Spectral centroid is formulated as the weighted mean of the time-frequency spectrum. It characterize the spectrum by specifying where the frequency center of the spectrum is located. Brightness is defined to be the proportion of the overall magnitude above certain frequency. Both could be used for the analysis of the average of the spectrum
Variation: Spectral Flux
Spectral flux is defined to be the fluctuations of the time-frequency spectrum. Different norms are used for different purposes and the most widely-accepted definition is 2-norm. In this case, spectral flux is calculated as the sum of squared differences between different frame's (or timepoint's) frequency diagram.
Attack Time
Attack time is defined to be the temporal duration of rise of a peak in a novel curve or a detection curve. A detection curve is the curve of energy throughout time and each peak in the detection curve corresponds to an event such as a note. It could characterize the type of instrument or the timbre of the preformance.
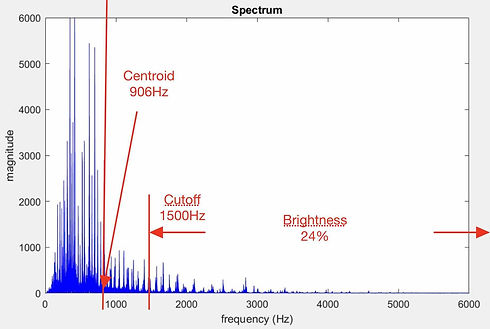
Spectral centroid and brightness are shown on the left. Spectral centroid is similar to the center of mass while brightness is similar to the arrangement of mass. Either could be used as a dimension for the analysis of timbre
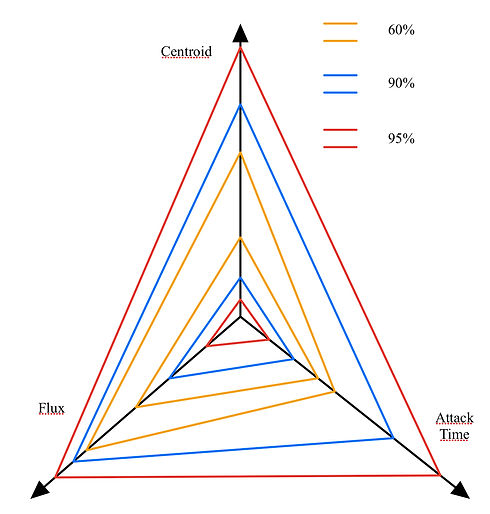
The multi-dimensional model shown on the left is an interpretation of our rating scheme. We would set up several intervals according to the distribution fitted for each dimension and put weights according to the statistical result such as the Pearson Correlation.
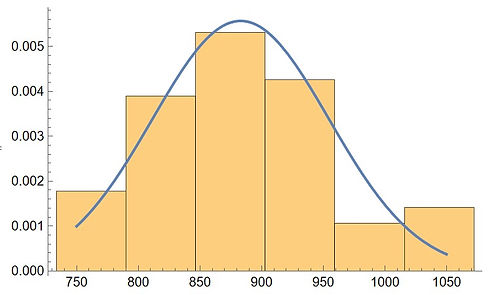
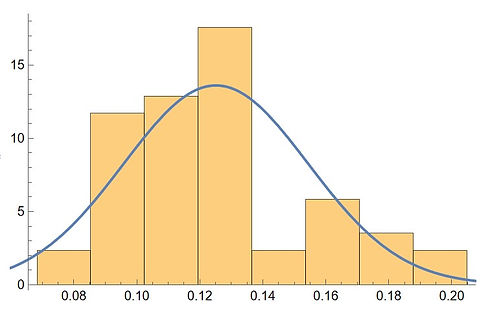
The spectral centroid is fitted on the right as a normal distribution in Mathematica. The brown column bars' width is chosen according to the Freedman-Diaconis Rule while the smooth blue line is the probability density function (PDF) of the fitted distribution. The x-axis is in the unit of Hz.
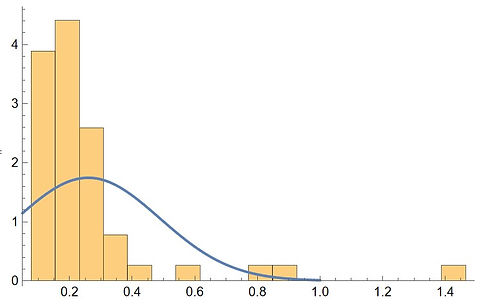
The attack time is fitted on the left as a normal distribution in Mathematica. The brown column bars' width is chosen according to the Freedman-Diaconis Rule while the smooth blue line is the probability density function (PDF) of the fitted distribution. The x-axis is in the unit of ms.